What is Channel Charting?
Channel charting learns a mapping from channel state information (CSI) to a so-called channel chart in which nearby datapoints indicate nearness in real space. In other words, the learned channel chart captures the nearby spatial geometry of the transmitting user equipments (UEs), effectively encoding relative (or logical) UE locations. Channel charting is self-supervised as the mapping from CSI to the channel chart is learned only using a database of passively collected CSI information. Such a data-driven localization approach has the advantages of being scalable and avoiding reference location information, e.g., from global navigation satellite systems (GNSSs). The self-supervised nature of channel charting also avoids the need for line-of-sight (LoS) propagation conditions or (costly) measurement campaigns, while enabling the infrastructure basestations or access points to perform cognitive and predictive radio access network (RAN) tasks which are tied to UE location.
Typical Channel Charting Pipeline
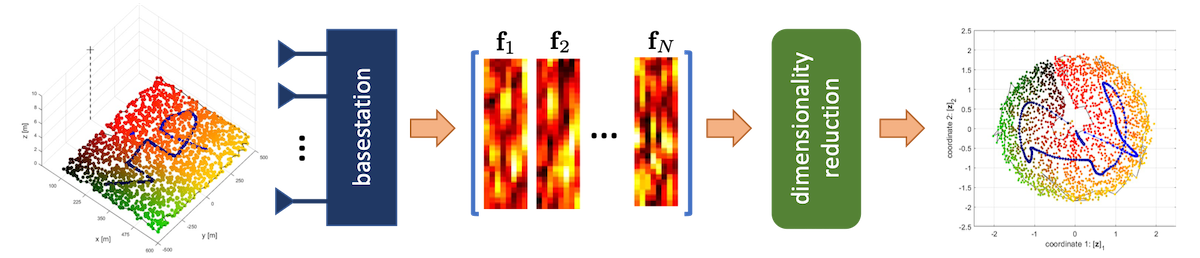
An infrastructure basestation (BS) or access point (AP) passively collects high-dimensional CSI (describing complex-valued frequency and time coefficients at possibly multiple antennas) from a large number transmitting UEs and/or UE locations. The BS or AP then extracts CSI features, which describe large-scale fading properties contained in the collected CSI. Finally, dimensionality reduction (DR)-techniques are applied to the CSI-feature database in order to learn a low-dimensional description, which is the channel chart. The channel chart has the key property that nearby points correspond to nearby locations in real space.
Typical Channel Chart from Real-World Measurements
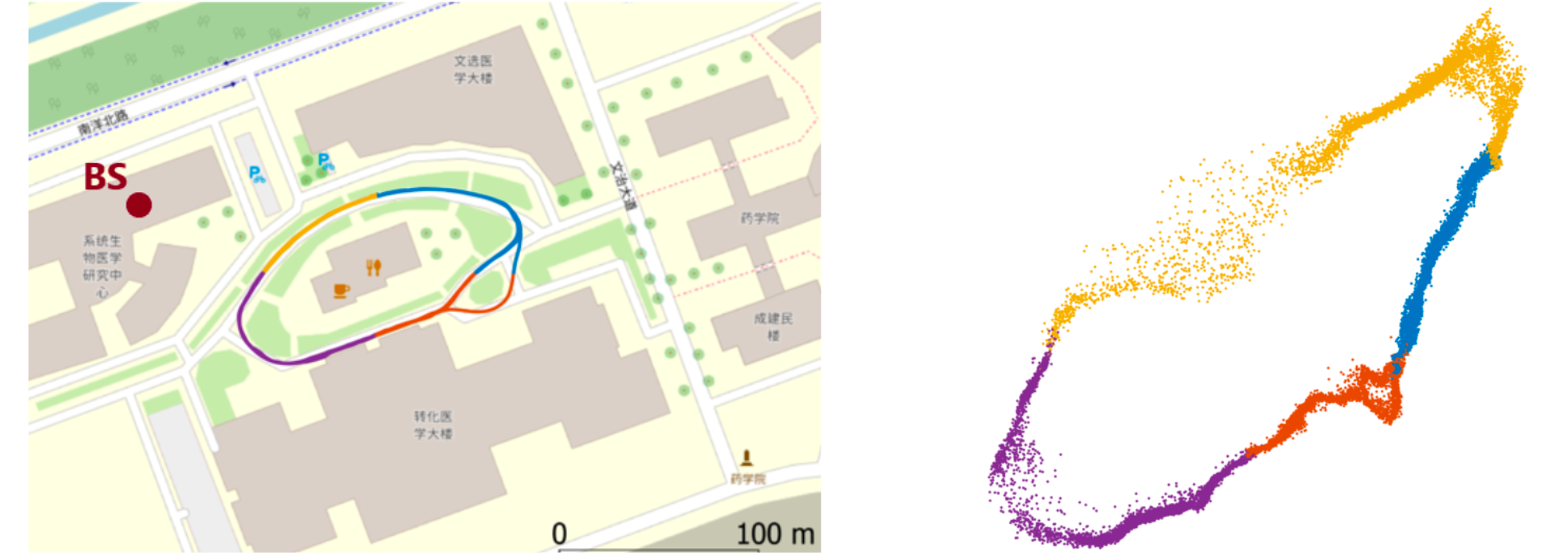
The above figure shows channel charting results obtained from real-world measurements (240,000 CSI samples) acquired with a 32-antenna BS operating at 2.5 GHz. The left part shows the measurement campaign consisting of a loop-shaped path acquired over 20 minutes with four quadrants colored differently. The right part shows the resulting channel chart obtained using a triplet-loss-based neural network. One can see that local geometry is very well preserved in the channel chart. Consequently, tracking user equipments in the channel chart will enable location dependent tasks in a purely self-supervised fashion. The above figure is courtesy of Ferrand, Decurninge, Ordoñez, and Guillaud, 2021.
Publications
2018
-
C. Studer, S. Medjkouh, E. Gönültaş, T. Goldstein, and O. Tirkkonen, “Channel Charting: Locating Users Within the Radio Environment Using Channel State Information,” IEEE Access, Vol. 6, pp. 47682-47698, Aug. 2018
-
J. Deng, S. Medjkouh, N. Malm, O. Tirkkonen, and C. Studer, “Multipoint Channel Charting for Wireless Networks,” 52nd Asilomar Conference on Signals, Systems, and Computers, Oct. 2018
2019
-
T. Ponnada, J. Al-Tous, O. Tirkkonen, and C. Studer, “An Out-of-Sample Extension for Wireless Multipoint Channel Charting,” Intl. Conference on Cognitive Radio Oriented Wireless Networks, June 2019
-
P. Huang, O. Castañeda, E. Gönültaş, S. Medjkouh, O. Tirkkonen, T. Goldstein, and C. Studer, “Improving Channel Charting with Representation-Constrained Autoencoders,” IEEE 20th Intl. Workshop on Signal Processing Advances in Wireless Communications (SPAWC), July 2019
-
E. Lei, O. Castañeda, O. Tirkkonen, T. Goldstein, and C. Studer, “Siamese Neural Networks for Wireless Positioning and Channel Charting,” 57th Annual Allerton Conference on Communication, Control, and Computing (Allerton), Sep. 2019
2020
-
C. Geng, J. Huang, and J. Langerman, “Multipoint Channel Charting with Multiple-Input Multiple-Output Convolutional Autoencoder,” IEEE/ION Position, Location and Navigation Symposium (PLANS), Apr. 2020, paywall link
-
P. Agostini, Z. Utkovski, and S. Stańczak, “Channel Charting: An Euclidean Distance Matrix Completion Perspective,” IEEE Intl. Conference on Acoustics, Speech and Signal Processing (ICASSP), May 2020, paywall link
-
P. Kazemi, H. Al-Tous, C. Studer, and O. Tirkkonen, “SNR Prediction in Cellular Systems based on Channel Charting,” IEEE Eighth Intl. Conference on Communications and Networking (ComNet), Oct. 2020
-
P. G. Burguera, “Logical Radio Maps for User Localization in a Real Outdoor Radio Environment,” M.S. Thesis report, Aalto University, Finland, Nov. 2020
-
J. Pihlajasalo, M. Koivisto, J. Talvitie, S. Ali-Löytty, M. Valkama, “Absolute Positioning with Unsupervised Multipoint Channel Charting for 5G Networks,” IEEE 92nd Vehicular Technology Conference (VTC2020-Fall), Nov. 2020, paywall link
-
H. Al-Tous, T. Ponnada, C. Studer, and O. Tirkkonen, “Multipoint Channel Charting-Based Radio Resource Management for V2V Communications,” EURASIP Journal on Wireless Communications and Networking, Dec. 2020
-
P. Ferrand, A. Decurninge, L. G. Ordoñez, and M. Guillaud, “Triplet-Based Wireless Channel Charting,” IEEE Global Communications Conference (GLOBECOM), Dec. 2020
-
L. Ribeiro, M. Leinonen, D. Djelouat, and M. Juntti, “Channel Charting for Pilot Reuse in mMTC with Spatially Correlated MIMO Channels,” IEEE Globecom Workshops, Dec. 2020, paywall link
2021
-
H. Al-Tous, O. Tirkkonen, and J. Liang, “Adaptive Sector Splitting based on Channel Charting in Massive MIMO Cellular Systems,” 2021 IEEE 93rd Vehicular Technology Conference (VTC2021-Spring), Apr. 2021, paywall link
-
T. Ponnada, H. Al-Tous, O. Tirkkonen, “Location-Free Beam Prediction in mmWave Systems,” IEEE 93rd Vehicular Technology Conference (VTC2021-Spring), Apr. 2021, paywall link
-
P. Kazemi, T. Ponnada, H. Al-Tous, Y.-C. Liang, and O. Tirkkonen, “Channel Charting Based Beam SNR Prediction,” Joint European Conference on Networks and Communications & 6G Summit (EuCNC/6G Summit), June 2021, paywall link
-
T. Ponnada, P. Kazemi; H. Al-Tous; Y.-C. Liang, and O. Tirkkonen, “Best Beam Prediction in Non-Standalone mm Wave Systems,” Joint European Conference on Networks and Communications & 6G Summit (EuCNC/6G Summit), June 2021, paywall link
-
J. Deng, O. Tirkkonen; J. Zhang; X. Jiao, and C. Studer, “Network-side Localization via Semi-Supervised Multi-point Channel Charting,” International Wireless Communications and Mobile Computing (IWCMC), June 2021, paywall link
-
Q. Zhang and W. Saad, “Semi-Supervised Learning for Channel Charting-Aided IoT Localization in Millimeter Wave Networks,” accepted to IEEE GLOBECOM 2021, arXiv preprint: 2108.08241, Aug. 2021
-
P. Ferrand, A. Decurninge, L. G. Ordoñez, and M. Guillaud, “Triplet-Based Wireless Channel Charting: Architecture and Experiments,” IEEE Journal on Selected Areas in Communications, Aug. 2021
-
L. Le Magoarou, “Efficient Channel Charting via Phase-Insensitive Distance Computation,” IEEE Wireless Communications Letters, Sep. 2021
-
B. Rappaport, E. Gönültaş, J. Hoydis, M. Arnold, P. K. Srinath, and C. Studer, “Improving Channel Charting using a Split Triplet Loss and an Inertial Regularizer,” IEEE 17th International Symposium on Wireless Communication Systems (ISWCS), Sept. 2021
-
I. Karmanov, F. G. Zanjani, I. Kadampot, S. Merlin and D. Dijkman, “WiCluster: Passive Indoor 2D/3D Positioning using WiFi without Precise Labels,” IEEE Global Communications Conference (GLOBECOM), Madrid, Spain, Dec. 2021
2022
-
L. Ribeiro, M. Leinonen, H. Al-Tous, O. Tirkkonen, and M. Juntti, “Pilot Reuse for mMTC with Spatially Correlated MIMO Channels: A Channel Charting Approach,” arXiv preprint, Mar. 2022
-
A. Patrick, Z. Utkovski, S. Stańczak, A. A. Memon, B. Zafar, and M. Haardt., “Not-Too-Deep Channel Charting (N2D-CC),” IEEE Wireless Communications and Networking Conference (WCNC), Apr. 2022, paywall link
-
P. Kazemi, H. Al-Tous, C. Studer, and O. Tirkkonen, “Channel Charting Assisted Beam Tracking,” IEEE 95th Vehicular Technology Conference: (VTC2022-Spring), June 2022, paywall link
-
P. Q. Viet and D. Romero, “Implicit Channel Charting with Application to UAV-aided Localization,” IEEE International Workshop on Signal Processing Advances in Wireless Communications (SPAWC), July 2022
-
F. Euchner, P. Stephan, M. Gauger, S. Dörner, S. ten Brink, “Improving Triplet-Based Channel Charting on Distributed Massive MIMO Measurements,” IEEE International Workshop on Signal Processing Advances in Wireless Communications (SPAWC), July 2022
2023
-
A. Aly, E. Ayanoglu, “Estimation of Cellular Wireless User Coordinates via Channel Charting and MUSIC,” International Conference on Computing, Networking and Communications (ICNC), Feb. 2023, paywall link
-
M. Stahlke, G. Yammine, T. Feigl, B. W. Eskofier, C. Mutschler, “Indoor Localization with Robust Global Channel Charting: A Time-Distance-Based Approach,” IEEE Transactions on Machine Learning in Communications and Networking, Mar. 2023; paywall link, GitHub repository
-
P. Ferrand, M. Guillaud, C. Studer, O. Tirkkonen, “Wireless Channel Charting: Theory, Practice, and Applications,” IEEE Communications Magazine, Jun. 2023
-
S. Taner, V. Palhares, C. Studer, “Channel Charting in Real-World Coordinates,” IEEE GLOBECOM 2023, Aug. 2023
-
T. Yassine, L. Le Magoarou, M. Crussière, S. Paquelet, “Optimizing Multicarrier Multiantenna Systems for LoS Channel Charting”
-
H. Aghajari, M. Naderi Soorki, S. Ahmadinabi, A. Rezazadeh, S. Ranjbaran, M. Nitti “Multi-Point Channel Charting for Long Range Wireless Networks: an Experimental Study,” IEEE International Mediterranean Conference on Communications and Networking (MeditCom), Sep. 2023, paywall link
-
T. Yassine, B. Chatelier, V. Corlay, M. Crussière, S. Paquelet, O. Tirkkonen, L. Le Magoarou, “Model-based Deep Learning for Beam Prediction based on a Channel Chart,” Asilomar Conference on Signals, Systems, and Computers, Nov. 2023
-
F. Euchner, P. Stephan, S. ten Brink, “Augmenting Channel Charting with Classical Wireless Source Localization Techniques,” Asilomar Conference on Signals, Systems, and Computers, Nov. 2023, GitHub repository
-
S. Taner, M. Guillaud, O. Tirkkonen, C. Studer, “Channel Charting for Streaming CSI Data,” Asilomar Conference on Signals, Systems, and Computers, Nov. 2023
-
P. Agostini, Z. Utkovski, I. Bjelakovic, S. Stańczak, “Learning Privacy-Preserving Channel Charts,” Asilomar Conference on Signals, Systems, and Computers, Nov. 2023, paywall link
-
P. Agostini, Z. Utkovski, S. Stańczak, “Channel Charting for Beam Management in Sub-THz Systems,” Asilomar Conference on Signals, Systems, and Computers, Nov. 2023, paywall link
-
M. Stahlke, G. Yammine, T. Feigl, B. M. Eskofier, C. Mutschler, “Velocity-Based Channel Charting with Spatial Distribution Map Matching,” submitted to IEEE Journal on Selected Areas in Communications, Nov. 2023
-
S. Taner, V. Palhares, C. Studer, “Channel Charting in Real-World Coordinates,” IEEE Global Communications Conference (GLOBECOM), Dec. 2023
2024
-
P. Stephan, F. Euchner, S. ten Brink, “Angle-Delay Profile-Based and Timestamp-Aided Dissimilarity Metrics for Channel Charting,” IEEE Transactions on Communications, Apr. 2024
-
O. Esrafilian, M. Ahadi, F. Kaltenberger, D. Gesbert, “Global Scale Self-Supervised Channel Charting with Sensor Fusion,” arXiv preprint, May 2024
-
L. Zhao, Y. Yang, Q. Xiong, H. Wang, B. Yu, F. Sun, C. Sun, “A Signature Based Approach Towards Global Channel Charting with Ultra Low Complexity,” IEEE International Conference on Communications Workshops (ICC Workshops), Jun. 2024
-
F. Euchner, P. Stephan, S. ten Brink, “Leveraging the Doppler Effect for Channel Charting,” 25th IEEE International Workshop on Signal Processing Advances in Wireless Communications (SPAWC), Sep. 2024, GitHub repository
-
B. Shaikh, P. G. Burguera, H. Al-Tous, M. Juntti, M. Khan, O. Tirkkonen, “Pilot Assignment based on AoA Information using Channel Charting in Massive MIMO Systems,” 25th IEEE International Workshop on Signal Processing Advances in Wireless Communications (SPAWC), Sep. 2024
-
Y. Vindas, M. Guillaud, “Multi-Site Wireless Channel Charting Through Latent Space Alignment,” 25th IEEE International Workshop on Signal Processing Advances in Wireless Communications (SPAWC), Sep. 2024
-
F. Euchner, P. Stephan, S. ten Brink, “Uncertainty-Aware Dimensionality Reduction for Channel Charting with Geodesic Loss,” Asilomar Conference on Signals, Systems, and Computers, Oct. 2024, GitHub repository
-
P. G. Burguera, B. Shaikh, H. Al-Tous, O. Tirkkonen, “Pilot Allocation for Cell-Free Massive MIMO based on Channel Charting,” Asilomar Conference on Signals, Systems, and Computers, Oct. 2024
-
B. Chatelier, V. Corlay, M. Crussière, L. Le Magoarou, “CSI Compression using Channel Charting,” Asilomar Conference on Signals, Systems, and Computers, Oct. 2024
-
C. B. Chaaya, A. M. Girgis, M. Bennis, “Learning Latent Wireless Dynamics from Channel State Information,” IEEE Wireless Communications Letters, Dec. 2024
-
H. Che, L. You, J. Wang, Z. Jin, C. Xie, X. Gao, “Channel Charting-assisted Non-orthogonal Pilot Allocation for Uplink XL-MIMO Transmission,” arXiv preprint, Dec. 2024
2025
-
M. Stahlke, “Channel Charting assisted Radio Localization: Towards Reliability and Robustness,” doctoral thesis, Jan. 2025
-
P. Kazemi, “Channel Charting-based Radio Resource Management,” doctoral thesis, Mar. 2025
-
P. Stephan, F. Euchner, S. ten Brink, “Channel Charting-Based Channel Prediction on Real-World Distributed Massive MIMO CSI,” IEEE Wireless Communications and Networking Conference (WCNC), Mar. 2025, GitHub repository
-
F. Euchner, D. Kellner, P. Stephan, S. ten Brink, “Passive Channel Charting: Locating Passive Targets using Wi-Fi Channel State Information,” arXiv preprint, Apr. 2025, GitHub repository
-
S. Taner, V. Palhares, C. Studer, “Channel Charting in Real-World Coordinates with Distributed MIMO,” IEEE Transactions on Wireless Communications, April 2025
-
R. Poeggel, M. Stahlke, J. Pirkl, J. Ott, G. Yammine, T. Feigl, and C. Mutschler, “Passive Channel Charting: Locating Passive Targets using a UWB Mesh,” arXiv preprint: 2505.10194, May 2025
-
M. E. M. Makhlouf, M. Guillaud, Y. Vindas, “Multi-cell Outdoor Channel State Information Dataset (MOCSID),” 2025 EuCNC & 6G Summit, June 2025
-
V. Palhares, S. Taner, and C. Studer, “CSI2Vec: Towards a Universal CSI Feature Representation for Positioning and Channel Charting,” arXiv preprint: 2506.05237, June 2025
-
Ge Chen, P. Chen, and L. Cheng, “Deep Tensor Learning for Reliable Channel Charting from Incomplete and Noisy Measurements,” arXiv preprint: 2509.13030, Sep. 2025
-
P. Stephan, F. Euchner, S. ten Brink, “CSI Obfuscation: Single-Antenna Transmitters Can Not Hide from Adversarial Multi-Antenna Radio Localization Systems,” 28th International Workshop on Smart Antennas (WSA), Sep. 2025, GitHub repository
-
Y. Zhang, G. Pan, M. F. Keskin, O. Kaltiokallio, M. Valkama, and H. Wymeersch, “UNILocPro: Unified Localization Integrating Model-Based Geometry and Channel Charting,” arXiv preprint: 2510.27394, Oct. 2025
-
R. Wiesmayr, F. Zumegen, S. Taner, C. Dick, and C. Studer, “CSI-Based User Positioning, Channel Charting, and Device Classification with an NVIDIA 5G Testbed,” in Asilomar Conf. Signals, Syst., Comput., arXiv preprint:2512.10809, Oct. 2025
-
H. Abbass, L. Le Magoarou, J. Farah, and M. Crussière, “Channel Charting for Efficient Precoding in Cell-Free Massive MIMO,” 59th Asilomar Conference on Signals, Systems, and Computers, Oct. 2025
-
M. E. M. Makhlouf, Y. Vindas, A. Kumar, M. Guillaud, and M. Di Renzo, “Charting Channels in the Presence of RIS,” 59th Asilomar Conference on Signals, Systems, and Computers, Oct. 2025
-
P. Stephan, F. Euchner, S. ten Brink, “Three-Dimensional Radio Localization: A Channel Charting-Based Approach,” 59th Asilomar Conference on Signals, Systems, and Computers, Oct. 2025, GitHub repository
-
J. Pirkl, J. Ott, M. Stahlke, G. Yammine, T. Feigl, and C. Mutschler, “Resilient Channel Charting Under Varying Radio Link Availability,” 59th Asilomar Conference on Signals, Systems, and Computers, Oct. 2025
-
J. M. Mateos-Ramos, F. Zumegen, H. Wymeersch, C. Häger, and C. Studer, “Positioning via Digital-Twin-Aided Channel Charting with Large-Scale CSI Features,” arXiv preprint: 2511.09227, Nov. 2025
2026
-
H. Huang, G. Pan, K. Huang, S. Zhang, Y. Zhang, M. F. Keskin, Z. Xing, and H. Wymeersch, “A Retrieval-Assisted Framework for Wireless Localization,” arXiv preprint: 2603.06158, Mar. 2026
-
M. Ahadi, O. Esrafilian, F. Kaltenberger, and A. Malik, “TDoA-Based Self-Supervised Channel Charting with NLoS Mitigation,” IEEE Transactions on Machine Learning in Communications and Networking, Apr. 2026
-
A. Kumar, Y. Vindas, and M. Guillaud, “Doppler-Supervised Channel Charting,” IEEE International Conference on Communications (ICC), May 2026
-
N. Saba, P. Garau Burguera, J. Liao, H. Al-Tous, O. Tirkkonen, and R. Jäntti, “Backscatter Devices Assisted Channel Charting,” IEEE Vehicular Technology Conference (VTC), Jun. 2026
Tutorials
-
P. Stephan, “Timestamp / Triplet-Based Channel Charting,” Online Tutorial, Jul. 2022
-
F. Euchner, C. Eun Lee, and P. Stephan “Dissimilarity Metric-Based Channel Charting,” Online Tutorial, Oct. 2023
-
M. Guillaud and C. Studer, “Wireless Channel Charting for Next-Generation Radio Access Networks,” IEEE International Conference on Machine Learning for Communication and Networking (ICMLCN), May 2025
Software
-
C. Studer, E. Gonultas, and S. Medjkouh, “Simple Channel Charting MATLAB Simulator,” MATLAB code including datasets
-
M. Stahlke, G. Yammine, T. Feigl, B. W. Eskofier, C. Mutschler, Source code for “Indoor Localization with Robust Global Channel Charting”
-
P. Stephan, “Timestamp / Triplet-Based Channel Charting,” Jupyter Notebook, Tutorial with code
-
F. Euchner, C. Eun Lee and P. Stephan, “Dissimilarity Metric-Based Channel Charting,” Jupyter Notebook, Tutorial with code
-
F. Euchner, “Time of Arrival / Angle of Arrival-augmented Channel Charting,” Jupyter Notebooks
-
F. Euchner, S. ten Brink, “Channel Charting with WiFi CSI Datasets generated by ESPARGOS,” Jupyter Notebooks
-
F. Euchner, “Passive Channel Charting,” Jupyter Notebooks
-
P. Stephan, “Channel Charting-Based Channel Prediction,” Jupyter Notebooks
-
P. Stephan, “Adversarial Radio Localization / Channel Charting,” Jupyter Notebooks
-
P. Stephan, “3D Channel Charting,” Jupyter Notebooks
-
S. Taner, “Channel Charting for Streaming CSI,” GitHub repository with PyTorch code for the results in the Asilomar 2023 paper on “Channel Charting for Streaming CSI Data,”by S. Taner, M. Guillaud, O. Tirkkonen, and C. Studer
-
S. Taner, “Channel Charting in Real-World Coordinates with Distributed MIMO,” GitHub repository with PyTorch code for the results in the IEEE Transactions on Wireless Communications 2025 paper on “Channel Charting in Real-World Coordinates with Distributed MIMO,” by S. Taner, V. Palhares, and C. Studer
CSI Datasets
Below is a compilation of links to some real-world measurement datasets that contain CSI data. These datasets have previously been used to showcase Channel Charting:
-
CSI Acquisition at ETH Zurich (CAEZ): CSI from a 5G and a Wi-Fi testbed measured at ETH Zurich in various indoor and outdoor scenarios, includes “ground truth” positions and wideband OFDM-domain CSI from multiple distributed 5G radio units and Wi-Fi access points.
-
Fraunhofer UWB and 5G datasets: Measured in an indoor environment, includes channel impulse responses and time of flight / time difference of arrival data, includes “ground truth” positions.
-
University of Stuttgart DICHASUS dataset collection: CSI data from a distributed massive MIMO-OFDM channel sounder, with time and phase synchronization, includes “ground truth” positions. Various environments and frequencies (indoor / outdoor / industrial).
-
University of Stuttgart ESPARGOS dataset collection: CSI data from a WiFi-based MIMO-OFDM channel sounder, with phase synchronization, includes “ground truth” positions.
Patents
- C. Studer and O. Tirkkonen, “Channel Charting in Wireless Systems,” U.S. Patent No. 10911168, Feb. 2021
Contact
This website is maintained by the Integrated Information Processing (IIP) Group, led by Prof. Christoph Studer, in the Department of Information Technology and Electrical Engineering at ETH Zürich, Switzerland.
Suggest a Resource
In case you would like to suggest a publication, patent, dataset, or software link, then please contact Christoph Studer and provide all the necessary details required to create an item in the above lists. Please note that we prefer open-access resources and discourage the use of papers behind a paywall.
Website last updated by Christoph Studer on November 13, 2025.